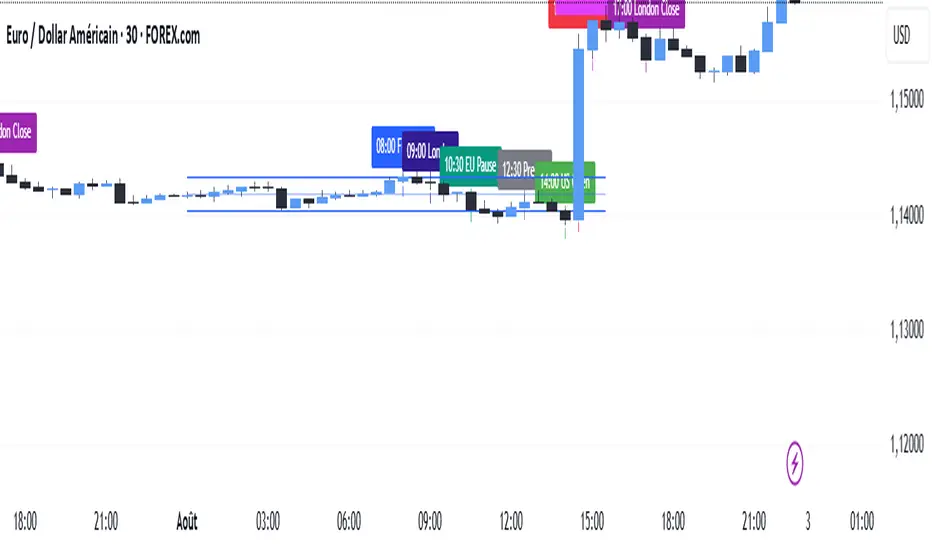
Session Open Candle MarkerThe "Session Open Candle Marker" is a Pine Script indicator designed for forex and futures traders using Smart Money Concepts (SMC) and RP Profits-inspired strategies. It marks the 15-minute opening range candles for the Asia, London, and NY sessions, where institutional "big players" often gather liquidity. Each session’s range is drawn as a rectangle with a customizable midpoint line, ideal for spotting breakouts, retests, and liquidity sweeps.
Features
Session Open Ranges: Plots rectangles for the 15m open candles of Asia (03:00 EEST), London (10:00 EEST), and NY (15:00 EEST), corresponding to 01:00, 08:00, and 13:00 GMT+1.
Customizable Visualization:
Toggle each session (Asia, London, NY) on/off.
Independent high/low label toggles for each session.
Adjustable rectangle color, midpoint line color, style (solid/dashed/dotted), and width.
Customizable rectangle duration (default: 96 bars, ~24 hours on 15m).
Timezone Flexibility: Default times are set for EEST (UTC+3). Adjust session inputs for your chart’s timezone (e.g., GMT+1: Asia 01:00, London 08:00, NY 13:00; UTC: Asia 00:00, London 07:00, NY 12:00).
Clean Design: Rectangles and labels update dynamically, with proper cleanup to avoid clutter.
Usage:
Setup: Add to a 15m chart (e.g., EURUSD, ES1!). Check your chart’s timezone (Chart Settings > Symbol > Timezone) and adjust session times if needed.
Settings:
Toggle sessions and labels to focus on desired ranges (e.g., London and NY for high volatility).
Customize colors, midpoint line style/width, and rectangle duration.
Trading:
Breakouts/Retests: Trade breakouts above/below the rectangle high/low, with retests back to the range or midpoint (aligned with RP Profits scalping).
Liquidity Sweeps: Watch for price sweeping session highs/lows, reversing for entries (SMC concept).
在腳本中搜尋"smart money"

PriceActionLibrary "PriceAction"
Hi all!
This library will help you to plot the market structure and liquidity. By now, the only part in the price action section is liquidity, but I plan to add more later on. The market structure will be split into two parts, 'Internal' and 'Swing' with separate pivot lengths. For these two trends it will show you:
• Break of structure (BOS)
• Change of character (CHoCH/CHoCH+) (mandatory)
• Equal high/low (EQH/EQL)
It's inspired by "Smart Money Concepts (SMC) " by LuxAlgo.
This library is now the same code as the code in my library 'MarketStructure', but it has evolved into a more price action oriented library than just a market structure library. This is more accurate and I will continue working on this library to keep it growing.
This code does not provide any examples, but you can look at my indicators 'Market structure' () and 'Order blocks' (), where I use the 'MarketStructure' library (which is the same code).
Market structure
Both of these market structures can be enabled/disabled by setting them to 'na'. The pivots lengths can be configured separately. The pivots found will be the 'base' of and will show you when price breaks it. When that happens a break of structure or a change of character will be created. The latest 5 pivots found within the current trends will be kept to take action on. They are cleared on a change of character, so nothing (break of structures or change of characters) can happen on pivots before a trend change. The internal market structure is shown with dashed lines and swing market structure is shown with solid lines.
Labels for a change of character can have either the text 'CHoCH' or 'CHoCH+'. A Change of Character plus is formed when price fails to form a higher high or a lower low before reversing. Note that a pivot that is created after the change of character might have a higher high or a lower low, thus not making the break a 'CHoCH+'. This is not changed after the pivot is found but is kept as is.
A break of structure is removed if an earlier pivot within the same trend is broken, i.e. another break of structure (with a longer distance) is created. Like in the images below, the first pivot (in the first image) is removed when an earlier pivot's higher price within the same trend is broken (the second image):
[image [https://www.tradingview.com/x/PRP6YtPA/
Equal high/lows have a configurable color setting and can be configured to be extended to the right. Equal high/lows are only possible if it's not been broken by price. A factor (percentage of width) of the Average True Length (of length 14) that the pivot must be within to to be considered an Equal high/low. Equal highs/lows can be of 2 pivots or more.
You are able to show the pivots that are used. "HH" (higher high), "HL" (higher low), "LH" (lower high), "LL" (lower low) and "H"/"L" (for pivots (high/low) when the trend has changed) are the labels used. There are also labels for break of structures ('BOS') and change of characters ('CHoCH' or 'CHoCH+'). The size of these texts is set in the 'FontSize' setting.
When programming I focused on simplicity and ease of read. I did not focus on performance, I will do so if it's a problem (haven't noticed it is one yet).
You can set alerts for when a change of character, break of structure or an equal high/low (new or an addition to a previously found) happens. The alerts that are fired are on 'once_per_bar_close' to avoid repainting. This has the drawback to alert you when the bar closes.
Price action
The indicator will create lines and zones for spotted liquidity. It will draw a line (with dotted style) at the price level that was liquidated, but it will also draw a zone from that level to the bar that broke the pivot high or low price. If that zone is large the liquidation is big and might be significant. This can be disabled in the settings. You can also change the confirmation candles (that does not close above or below the pivot level) needed after a liquidation and how many pivots back to look at.
The lines and boxes drawn will look like this if the color is orange:
Hope this is of help!
Will draw out the market structure for the disired pivot length.
Liqudity(liquidity)
Will draw liquidity.
Parameters:
liquidity (Liquidity) : The 'PriceAction.Liquidity' object.
Pivot(structure)
Sets the pivots in the structure.
Parameters:
structure (Structure)
PivotLabels(structure)
Draws labels for the pivots found.
Parameters:
structure (Structure)
EqualHighOrLow(structure)
Draws the boxes for equal highs/lows. Also creates labels for the pivots included.
Parameters:
structure (Structure)
BreakOfStructure(structure)
Will create lines when a break of strycture occures.
Parameters:
structure (Structure)
Returns: A boolean that represents if a break of structure was found or not.
ChangeOfCharacter(structure)
Will create lines when a change of character occures. This line will have a label with "CHoCH" or "CHoCH+".
Parameters:
structure (Structure)
Returns: A boolean that represents if a change of character was found or not.
VisualizeCurrent(structure)
Will create a box with a background for between the latest high and low pivots. This can be used as the current trading range (if the pivots broke strucure somehow).
Parameters:
structure (Structure)
StructureBreak
Holds drawings for a structure break.
Fields:
Line (series line) : The line object.
Label (series label) : The label object.
Pivot
Holds all the values for a found pivot.
Fields:
Price (series float) : The price of the pivot.
BarIndex (series int) : The bar_index where the pivot occured.
Type (series int) : The type of the pivot (-1 = low, 1 = high).
Time (series int) : The time where the pivot occured.
BreakOfStructureBroken (series bool) : Sets to true if a break of structure has happened.
LiquidityBroken (series bool) : Sets to true if a liquidity of the price level has happened.
ChangeOfCharacterBroken (series bool) : Sets to true if a change of character has happened.
Structure
Holds all the values for the market structure.
Fields:
LeftLength (series int) : Define the left length of the pivots used.
RightLength (series int) : Define the right length of the pivots used.
Type (series Type) : Set the type of the market structure. Two types can be used, 'internal' and 'swing' (0 = internal, 1 = swing).
Trend (series int) : This will be set internally and can be -1 = downtrend, 1 = uptrend.
EqualPivotsFactor (series float) : Set how the limits are for an equal pivot. This is a factor of the Average True Length (ATR) of length 14. If a low pivot is considered to be equal if it doesn't break the low pivot (is at a lower value) and is inside the previous low pivot + this limit.
ExtendEqualPivotsZones (series bool) : Set to true if you want the equal pivots zones to be extended.
ExtendEqualPivotsStyle (series string) : Set the style of equal pivot zones.
ExtendEqualPivotsColor (series color) : Set the color of equal pivot zones.
EqualHighs (array) : Holds the boxes for zones that contains equal highs.
EqualLows (array) : Holds the boxes for zones that contains equal lows.
BreakOfStructures (array) : Holds all the break of structures within the trend (before a change of character).
Pivots (array) : All the pivots in the current trend, added with the latest first, this is cleared when the trend changes.
FontSize (series int) : Holds the size of the font displayed.
AlertChangeOfCharacter (series bool) : Holds true or false if a change of character should be alerted or not.
AlertBreakOfStructure (series bool) : Holds true or false if a break of structure should be alerted or not.
AlerEqualPivots (series bool) : Holds true or false if equal highs/lows should be alerted or not.
Liquidity
Holds all the values for liquidity.
Fields:
LiquidityPivotsHigh (array) : All high pivots for liquidity.
LiquidityPivotsLow (array) : All low pivots for liquidity.
LiquidityConfirmationBars (series int) : The number of bars to confirm that a liquidity is valid.
LiquidityPivotsLookback (series int) : A number of pivots to look back for.
FontSize (series int) : Holds the size of the font displayed.
PriceAction
Holds all the values for the general price action and the market structures.
Fields:
Liquidity (Liquidity)
Swing (Structure) : Placeholder for all objects used for the swing market structure.
Internal (Structure) : Placeholder for all objects used for the internal market structure.

Advanced Volume Profile Pro Delta + POC + VAH/VAL# Advanced Volume Profile Pro - Delta + POC + VAH/VAL Analysis System
## WHAT THIS SCRIPT DOES
This script creates a comprehensive volume profile analysis system that combines traditional volume-at-price distribution with delta volume calculations, Point of Control (POC) identification, and Value Area (VAH/VAL) analysis. Unlike standard volume indicators that show only total volume over time, this script analyzes volume distribution across price levels and estimates buying vs selling pressure using multiple calculation methods to provide deeper market structure insights.
## WHY THIS COMBINATION IS ORIGINAL AND USEFUL
**The Problem Solved:** Traditional volume indicators show when volume occurs but not where price finds acceptance or rejection. Standalone volume profiles lack directional bias information, while basic delta calculations don't provide structural context. Traders need to understand both volume distribution AND directional sentiment at key price levels.
**The Solution:** This script implements an integrated approach that:
- Maps volume distribution across price levels using configurable row density
- Estimates delta (buying vs selling pressure) using three different methodologies
- Identifies Point of Control (highest volume price level) for key support/resistance
- Calculates Value Area boundaries where 70% of volume traded
- Provides real-time alerts for key level interactions and volume imbalances
**Unique Features:**
1. **Developing POC Visualization**: Real-time tracking of Point of Control migration throughout the session via blue dotted trail, revealing institutional accumulation/distribution patterns before they complete
2. **Multi-Method Delta Calculation**: Price Action-based, Bid/Ask estimation, and Cumulative methods for different market conditions
3. **Adaptive Timeframe System**: Auto-adjusts calculation parameters based on chart timeframe for optimal performance
4. **Flexible Profile Types**: N Bars Back (precise control), Days Back (calendar-based), and Session-based analysis modes
5. **Advanced Imbalance Detection**: Identifies and highlights significant buying/selling imbalances with configurable thresholds
6. **Comprehensive Alert System**: Monitors POC touches, Value Area entry/exit, and major volume imbalances
## HOW THE SCRIPT WORKS TECHNICALLY
### Core Volume Profile Methodology:
**1. Price Level Distribution:**
- Divides price range into user-defined rows (10-50 configurable)
- Calculates row height: `(Highest Price - Lowest Price) / Number of Rows`
- Distributes each bar's volume across price levels it touched proportionally
**2. Delta Volume Calculation Methods:**
**Price Action Method:**
```
Price Range = High - Low
Buy Pressure = (Close - Low) / Price Range
Sell Pressure = (High - Close) / Price Range
Buy Volume = Total Volume × Buy Pressure
Sell Volume = Total Volume × Sell Pressure
Delta = Buy Volume - Sell Volume
```
**Bid/Ask Estimation Method:**
```
Average Price = (High + Low + Close) / 3
Buy Volume = Close > Average ? Volume × 0.6 : Volume × 0.4
Sell Volume = Total Volume - Buy Volume
```
**Cumulative Method:**
```
Buy Volume = Close > Open ? Volume : Volume × 0.3
Sell Volume = Close ≤ Open ? Volume : Volume × 0.3
```
**3. Point of Control (POC) Identification:**
- Scans all price levels to find maximum volume concentration
- POC represents the price level with highest trading activity
- Acts as significant support/resistance level
- **Developing POC Feature**: Tracks POC evolution in real-time via blue dotted trail, showing how institutional interest migrates throughout the session. Upward POC migration indicates accumulation patterns, downward migration suggests distribution, providing early trend signals before price confirmation.
**4. Value Area Calculation:**
- Starts from POC and expands up/down to encompass 70% of total volume
- VAH (Value Area High): Upper boundary of value area
- VAL (Value Area Low): Lower boundary of value area
- Expansion algorithm prioritizes direction with higher volume
**5. Adaptive Range Selection:**
Based on profile type and timeframe optimization:
- **N Bars Back**: Fixed lookback period with performance optimization (20-500 bars)
- **Days Back**: Calendar-based analysis with automatic timeframe adjustment (1-365 days)
- **Session**: Current trading session or custom session times
### Performance Optimization Features:
- **Sampling Algorithm**: Reduces calculation load on large datasets while maintaining accuracy
- **Memory Management**: Clears previous drawings to prevent performance degradation
- **Safety Constraints**: Prevents excessive memory usage with configurable limits
## HOW TO USE THIS SCRIPT
### Initial Setup:
1. **Profile Configuration**: Select profile type based on trading style:
- N Bars Back: Precise control over data range
- Days Back: Intuitive calendar-based analysis
- Session: Real-time session development
2. **Row Density**: Set number of rows (30 default) - more rows = higher resolution, slower performance
3. **Delta Method**: Choose calculation method based on market type:
- Price Action: Best for trending markets
- Bid/Ask Estimate: Good for ranging markets
- Cumulative: Smoothed approach for volatile markets
4. **Visual Settings**: Configure colors, position (left/right), and display options
### Reading the Profile:
**Volume Bars:**
- **Length**: Represents relative volume at that price level
- **Color**: Green = net buying pressure, Red = net selling pressure
- **Intensity**: Darker colors indicate volume imbalances above threshold
**Key Levels:**
- **POC (Blue Line)**: Highest volume price - major support/resistance
- **VAH (Purple Dashed)**: Value Area High - upper boundary of fair value
- **VAL (Orange Dashed)**: Value Area Low - lower boundary of fair value
- **Value Area Fill**: Shaded region showing main trading range
**Developing POC Trail:**
- **Blue Dotted Lines**: Show real-time POC evolution throughout the session
- **Migration Patterns**: Upward trail indicates bullish accumulation, downward trail suggests bearish distribution
- **Early Signals**: POC movement often precedes price movement, providing advance warning of institutional activity
- **Institutional Footprints**: Reveals where smart money concentrated volume before final POC establishment
### Trading Applications:
**Support/Resistance Analysis:**
- POC acts as magnetic price level - expect reactions
- VAH/VAL provide intermediate support/resistance levels
- Profile edges show areas of low volume acceptance
**Developing POC Analysis:**
- **Upward Migration**: POC moving higher = institutional accumulation, bullish bias
- **Downward Migration**: POC moving lower = institutional distribution, bearish bias
- **Stable POC**: Tight clustering = balanced market, range-bound conditions
- **Early Trend Detection**: POC direction change often precedes price breakouts
**Entry Strategies:**
- Buy at VAL with POC as target (in uptrends)
- Sell at VAH with POC as target (in downtrends)
- Breakout plays above/below profile extremes
**Volume Imbalance Trading:**
- Strong buying imbalance (>60% threshold) suggests continued upward pressure
- Strong selling imbalance suggests continued downward pressure
- Imbalances near key levels provide high-probability setups
**Multi-Timeframe Context:**
- Use higher timeframe profiles for major levels
- Lower timeframe profiles for precise entries
- Session profiles for intraday trading structure
## SCRIPT SETTINGS EXPLANATION
### Volume Profile Settings:
- **Profile Type**: Determines data range for calculation
- N Bars Back: Exact number of bars (20-500 range)
- Days Back: Calendar days with timeframe adaptation (1-365 days)
- Session: Trading session-based (intraday focus)
- **Number of Rows**: Profile resolution (10-50 range)
- **Profile Width**: Visual width as chart percentage (10-50%)
- **Value Area %**: Volume percentage for VA calculation (50-90%, 70% standard)
- **Auto-Adjust**: Automatically optimizes for different timeframes
### Delta Volume Settings:
- **Show Delta Volume**: Enable/disable delta calculations
- **Delta Calculation Method**: Choose methodology based on market conditions
- **Highlight Imbalances**: Visual emphasis for significant volume imbalances
- **Imbalance Threshold**: Percentage for imbalance detection (50-90%)
### Session Settings:
- **Session Type**: Daily, Weekly, Monthly, or Custom periods
- **Custom Session Time**: Define specific trading hours
- **Previous Sessions**: Number of historical sessions to display
### Days Back Settings:
- **Lookback Days**: Number of calendar days to analyze (1-365)
- **Automatic Calculation**: Script automatically converts days to bars based on timeframe:
- Intraday: Accounts for 6.5 trading hours per day
- Daily: 1 bar per day
- Weekly/Monthly: Proportional adjustment
### N Bars Back Settings:
- **Lookback Bars**: Exact number of bars to analyze (20-500)
- **Precise Control**: Best for systematic analysis and backtesting
### Visual Customization:
- **Colors**: Bullish (green), Bearish (red), and level colors
- **Profile Position**: Left or Right side of chart
- **Profile Offset**: Distance from current price action
- **Labels**: Show/hide level labels and values
- **Smooth Profile Bars**: Enhanced visual appearance
### Alert Configuration:
- **POC Touch**: Alerts when price interacts with Point of Control
- **VA Entry/Exit**: Alerts for Value Area boundary interactions
- **Major Imbalance**: Alerts for significant volume imbalances
## VISUAL FEATURES
### Profile Display:
- **Horizontal Bars**: Volume distribution across price levels
- **Color Coding**: Delta-based coloring for directional bias
- **Smooth Rendering**: Optional smoothing for cleaner appearance
- **Transparency**: Configurable opacity for chart readability
### Level Lines:
- **POC**: Solid blue line with optional label
- **VAH/VAL**: Dashed colored lines with value displays
- **Extension**: Lines extend across relevant time periods
- **Value Area Fill**: Optional shaded region between VAH/VAL
### Information Table:
- **Current Values**: Real-time POC, VAH, VAL prices
- **VA Range**: Value Area width calculation
- **Positioning**: Multiple table positions available
- **Text Sizing**: Adjustable for different screen sizes
## IMPORTANT USAGE NOTES
**Realistic Expectations:**
- Volume profile analysis provides structural context, not trading signals
- Delta calculations are estimations based on price action, not actual order flow
- Past volume distribution does not guarantee future price behavior
- Combine with other analysis methods for comprehensive market view
**Best Practices:**
- Use appropriate profile types for your trading style:
- Day Trading: Session or Days Back (1-5 days)
- Swing Trading: Days Back (10-30 days) or N Bars Back
- Position Trading: Days Back (60-180 days)
- Consider market context (trending vs ranging conditions)
- Verify key levels with additional technical analysis
- Monitor profile development for changing market structure
**Performance Considerations:**
- Higher row counts increase calculation complexity
- Large lookback periods may affect chart performance
- Auto-adjust feature optimizes for most use cases
- Consider using session profiles for intraday efficiency
**Limitations:**
- Delta calculations are estimations, not actual transaction data
- Profile accuracy depends on available price/volume history
- Effectiveness varies across different instruments and market conditions
- Requires understanding of volume profile concepts for optimal use
**Data Requirements:**
- Requires volume data for accurate calculations
- Works best on liquid instruments with consistent volume
- May be less effective on very low volume or exotic instruments
This script serves as a comprehensive volume analysis tool for traders who need detailed market structure information with integrated directional bias analysis and real-time POC development tracking for informed trading decisions.

BTC Power Law Valuation BandsBTC Power Law Rainbow
A long-term valuation framework for Bitcoin based on Power Law growth — designed to help identify macro accumulation and distribution zones, aligned with long-term investor behavior.
🔍 What Is a Power Law?
A Power Law is a mathematical relationship where one quantity varies as a power of another. In this model:
Price ≈ a × (Time)^b
It captures the non-linear, exponentially slowing growth of Bitcoin over time. Rather than using linear or cyclical models, this approach aligns with how complex systems, such as networks or monetary adoption curves, often grow — rapidly at first, and then more slowly, but persistently.
🧠 Why Power Law for BTC?
Bitcoin:
Has finite supply and increasing adoption.
Operates as a monetary network , where Metcalfe’s Law and power laws naturally emerge.
Exhibits exponential growth over logarithmic time when viewed on a log-log chart .
This makes it uniquely well-suited for power law modeling.
🌈 How to Use the Valuation Bands
The central white line represents the modeled fair value according to the power law.
Colored bands represent deviations from the model in logarithmic space, acting as macro zones:
🔵 Lower Bands: Deep value / Accumulation zones.
🟡 Mid Bands: Fair value.
🔴 Upper Bands: Euphoria / Risk of macro tops.
📐 Smart Money Concepts (SMC) Alignment
Accumulation: Occurs when price consolidates near lower bands — often aligning with institutional positioning.
Markup: As price re-enters or ascends the bands, we often see breakout behavior and trend expansion.
Distribution: When price extends above upper bands, potential for exit liquidity creation and distribution events.
Reversion: Historically, price mean-reverts toward the model — rarely staying outside the bands for long.
This makes the model useful for:
Cycle timing
Long-term DCA strategy zones
Identifying value dislocations
Filtering short-term noise
⚠️ Disclaimer
This tool is for educational and informational purposes only . It is not financial advice. The power law model is a non-predictive, mathematical framework and does not guarantee future price movements .
Always use additional tools, risk management, and your own judgment before making trading or investment decisions.

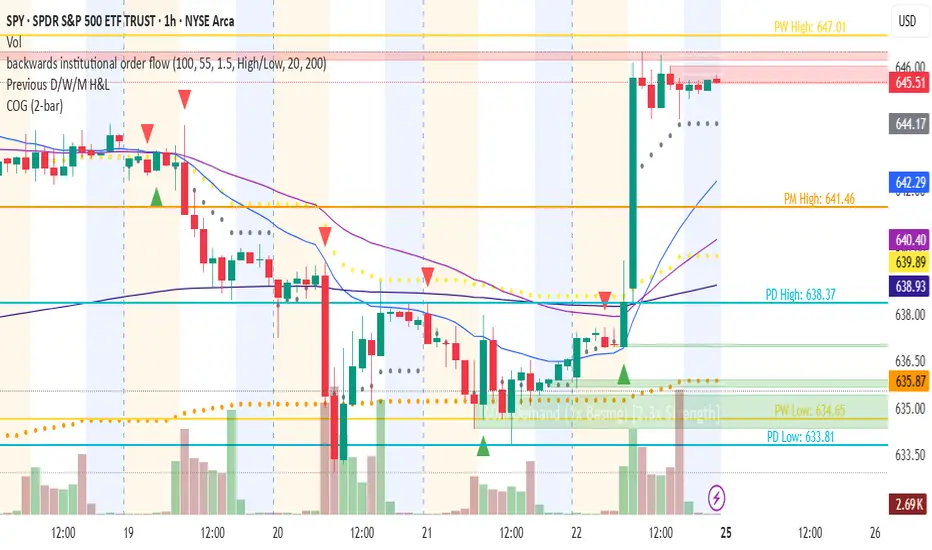
Changing of the GuardChanging of the Guard (COG) - Advanced Reversal Pattern Indicator
🎯 What It Does
The Changing of the Guard (COG) indicator identifies high-probability reversal setups by detecting specific candlestick patterns that occur at key institutional levels. This indicator combines traditional price action analysis with volume-weighted and moving average confluence to filter out noise and focus on the most reliable trading opportunities.
🔧 Key Features
Multi-Timeframe VWAP Analysis
• Daily VWAP (Gray circles) - Intraday institutional reference
• Weekly VWAP (Yellow circles) - Short-term institutional bias
• Monthly VWAP (Orange circles) - Long-term institutional sentiment
Triple EMA System
• EMA 20 (Blue) - Short-term trend direction
• EMA 50 (Purple) - Medium-term momentum
• EMA 200 (Navy) - Long-term market structure
Adaptive COG Pattern Detection
• 2-Bar Mode: Quick reversal signals for scalping
• 3-Bar Mode: Balanced approach for swing trading (default)
• 4-Bar Mode: Conservative signals for position trading
📊 How It Works
The indicator identifies "changing of the guard" moments when:
1. Pattern Formation: 2-4 consecutive bars show exhaustion in one direction
2. Reversal Confirmation: A counter-trend bar appears with strong momentum
3. Confluence Trigger: The reversal bar crosses through a significant VWAP or EMA level
Bullish COG: Green triangle appears below bars when bearish exhaustion meets bullish reversal at key support
Bearish COG: Red triangle appears above bars when bullish exhaustion meets bearish reversal at key resistance
💡 Trading Applications
Swing Trading: Use 3-bar mode with EMA 50/200 confluence for multi-day holds
Day Trading: Use 2-bar mode with Daily VWAP confluence for intraday reversals
Position Trading: Use 4-bar mode with Monthly VWAP confluence for major trend changes
⚙️ Customization Options
• Toggle VWAP display on/off
• Toggle EMA display on/off
• Toggle COG signals on/off
• Select detection mode (2-bar, 3-bar, 4-bar)
• Built-in alert system for automated notifications
🎨 Visual Design
Clean, professional interface with:
• Subtle dotted lines for VWAPs to avoid chart clutter
• Color-coded EMAs for easy trend identification
• Clear triangle signals that don't obstruct price action
• Customizable display options for different trading styles
📈 Best Practices
• Combine with volume analysis for additional confirmation
• Use higher timeframe bias to filter trade direction
• Consider market structure and support/resistance levels
• Backtest different modes to find optimal settings for your strategy
⚠️ Risk Management
This indicator identifies potential reversal points but should be used with proper risk management. Always consider:
• Overall market trend and structure
• Volume confirmation
• Multiple timeframe analysis
• Appropriate position sizing
Perfect for traders who want to catch reversals at institutional levels with high-probability setups. The confluence requirement ensures you're trading with the smart money, not against it.
Trishul Tap Signals (v6) — Liquidity Sweep + Imbalanced RetestTrishul Tap Signals — Liquidity Sweep + Imbalanced Retest
Type: Signal-only indicator (non-repainting)
Style: Price-action + Liquidity + Trend-following
Best for: Intraday & Swing Trading — any liquid market (stocks, futures, crypto, FX)
Timeframes: Any (5m–1D recommended)
Concept
The Trishul Tap setup is a liquidity-driven retest play inspired by order-flow and Smart Money Concepts.
It identifies one-sided impulse candles that also sweep liquidity (grab stops above/below a recent swing), then waits for price to retest the origin of that candle to enter in the trend direction.
Think of it as the three points of a trident:
Trend filter — Only signals with the prevailing trend.
Liquidity sweep — Candle takes out a recent swing high/low (stop-hunt).
Imbalanced retest — Price taps the candle’s open/low (bull) or open/high (bear).
Bullish Setup
Trend Filter: Price above EMA(200).
Impulse Candle:
Green close.
Upper wick ≥ (wickRatio × lower wick).
Lower wick ≤ (oppWickMaxFrac × full range).
Liquidity Sweep: Candle’s high exceeds the highest high of the last sweepLookback bars (excluding current).
Tap Entry: Buy signal triggers when price later taps the candle’s low or open (user choice) within expireBars.
Bearish Setup
Trend Filter: Price below EMA(200).
Impulse Candle:
Red close.
Lower wick ≥ (wickRatio × upper wick).
Upper wick ≤ (oppWickMaxFrac × full range).
Liquidity Sweep: Candle’s low breaks the lowest low of the last sweepLookback bars (excluding current).
Tap Entry: Sell signal triggers when price later taps the candle’s high or open (user choice) within expireBars.
Inputs
Trend EMA Length: Default 200.
Sweep Lookback: Number of bars for liquidity sweep check (default 20).
Wick Ratio: Required size ratio of dominant wick to opposite wick (default 2.0).
Opposite Wick Max %: Opposite wick must be ≤ this fraction of the candle’s range (default 25%).
Tap Tolerance (ticks): How close price must come to the level to count as a tap.
Expire Bars: Max bars after setup to allow a valid tap.
One Signal per Level: If ON, a base is “consumed” after first signal.
Plot Tap Levels: Show horizontal lines for active bases.
Show Setup Labels: Mark the origin sweep candle.
Plots & Visuals
EMA Trend Line — trend filter reference.
Tap Levels —
Green = bullish base (origin candle’s low/open).
Red = bearish base (origin candle’s high/open).
Labels — Show where the setup candle formed.
Signals —
BUY: triangle-up below bar at bullish tap.
SELL: triangle-down above bar at bearish tap.
Alerts
Two built-in conditions:
BUY Signal (Trishul Tap) — triggers on bullish tap.
SELL Signal (Trishul Tap) — triggers on bearish tap.
Set via Alerts panel → Condition = this indicator → Choose signal type.
How to Trade It
Use in liquid markets with clean price structure.
Confirm with HTF structure, volume spikes, or other confluence if desired.
Place stop just beyond the tap level (or ATR-based).
Target 1–2R or trail behind structure.
Why It Works
Liquidity sweep traps traders entering late (breakout buyers or panic sellers) and forces them to exit in the opposite direction, fueling your entry.
Wick imbalance confirms directional aggression by one side.
Trend filter keeps you aligned with the market’s dominant flow.
Retest entry lets you enter at a better price with reduced risk.
Non-Repainting
Setups form only on confirmed bar closes.
Signals trigger only on later bars that tap the stored level.
No lookahead functions are used.
Disclaimer
This script is for educational purposes only and does not constitute financial advice. Test thoroughly in a simulator or demo before using in live markets. Trading involves risk.

Apex Edge – Liquidity RaiderApex Edge – Liquidity Raider
The Predator That Hunts Where Retail Never Looks
The Liquidity Raider is not your average liquidity line plotter.
This is an institutional-grade hunting system that tracks the pools of liquidity Smart Money algos stalk — and tells you exactly when price is circling in for the strike.
Where most retail tools simply mark lines, this one acts like a predator:
Scans the chart dynamically to detect clustered highs & lows (pivot-based liquidity zones).
Filters noise with sensitivity & price rounding so you only get real liquidity levels — not every random swing.
Plots live BSL (Buy-Side Liquidity) & SSL (Sell-Side Liquidity) lines in clean dotted format.
Auto-deletes levels when swept, so your chart stays clean and focused.
Triggers directional arrows when price comes within your specified % distance to the target liquidity pool — before the market moves.
EMA confluence layer lets you align with institutional flow (customizable Fast & Slow EMAs).
Core Power
Cluster Logic – Finds high-probability liquidity zones using repeated pivot levels.
Sweep Awareness – Lines vanish the moment liquidity is taken, keeping focus on the next pool.
Proximity Strike Detection – Arrow signals only when price is within striking range.
Directional Clarity – Red arrows = targeting BSL, Green arrows = targeting SSL.
Scalable Across Timeframes – Adapts to your chart’s timeframe with dynamic lookback scaling.
Institutional Flow Filter – Optional EMA confirmation keeps you aligned with the real trend.
How to Use
Identify liquidity pools – Dotted green = buy-side, dotted red = sell-side.
Watch proximity arrows – These mean price is in range and hunting that pool.
Align with EMA bias – Enter only in the direction of institutional momentum.
Target the sweep – Your take profit is where the liquidity is resting.
Why Liquidity Raider Wins
This is not a lagging signal system.
It’s a real-time, clean, predictive tool designed to mimic the targeting logic of high-frequency algos.
By removing swept levels and focusing only on the next available pools, Liquidity Raider keeps you one step ahead of the crowd — and perfectly positioned for the kill shot.

ICT SMC Custom — BOS/MSS + OB + FVGWant me to fill that box? Here’s a ready‑to‑paste description for your publish screen:
⸻
ICT SMC Custom — BOS/MSS + OB + FVG (Crypto‑friendly)
A clean Smart Money Concepts tool that marks Break of Structure (BOS), Market Structure Shift (MSS), Order Blocks (OB), and Fair Value Gaps (FVG) with bold, easy‑to‑see visuals. Built for crypto but works on any market and timeframe.
What it does
• BOS & MSS detection with optional body/wick logic
• Order Blocks: auto‑draws the last opposite candle before a BOS, keeps only the most recent N, and fades when mitigated
• FVGs: 3‑candle gaps with a minimum size filter and a cap on how many to keep
• HTF Swings (optional): plots higher‑timeframe pivot highs/lows for top‑down context
• Alerts for BOS/MSS and FVG formation
Inputs
• Swing pivot length (default 3): sensitivity for structure pivots
• Use candle bodies for breaks: close vs level (on) or wicks (off)
• Show BOS/MSS labels, Show FVG, Show Order Blocks
• Min FVG size (ticks) and Max boxes to keep for FVG/OB
• OB uses candle body: body range vs full wick range
• Show higher timeframe swings + HTF timeframe
• Bullish/Bearish colors
How it works
• BOS triggers when price breaks the last opposite swing.
• MSS flags when the break flips the prior bias.
• OB is the most recent opposite candle prior to BOS; it’s marked and later greyed out once price closes through it (mitigation).
• FVG is detected when candle 1’s high < candle 3’s low (bear) or candle 1’s low > candle 3’s high (bull).
Alerts included
• BOS Up / BOS Down
• MSS Up / MSS Down
• FVG Up / FVG Down
Tips
• Start on 15m/1h for crypto, pivot length 3–5.
• Turn Use candle bodies ON for stricter confirmations, OFF for more signals.
• If boxes look cluttered, lower “Max boxes to keep.”
Note: This is a visual/educational tool, not financial advice. Always confirm with your own plan and risk management.

Razor Precision — Buy/SellRazor Precision Stock Action Indicator
The Razor Precision indicator is an advanced, multi-layered market analysis tool designed for traders who demand accuracy and alignment across multiple timeframes. It combines price action, moving average crossovers, volume confirmation, swing structure mapping, and indicator confluence (RSI, MACD, ATR, OBV) to generate actionable buy/sell strength ratings.
Key Features:
Price Action Detection: Identifies higher highs/lows (uptrend) and lower highs/lows (downtrend).
MA Crossover Momentum: Monitors 50/200 moving average crossovers to detect trend shifts.
Volume Surge Analysis: Confirms breakouts or pullbacks with significant volume spikes.
Swing Structure Tracking: Maps internal/external breaks to align with Smart Money Concepts.
Indicator Confluence: Aggregates signals from RSI, MACD, ATR, and OBV for precision confirmation.
Multi-Timeframe Alignment: Compares trends across 15m, 1H, 4H, and Daily charts for stacked or conflicting signals.
Strength Levels: Signals range from SELL, STRONG SELL, ULTRA STRONG SELL to BUY, STRONG BUY, ULTRA STRONG BUY.
Dynamic Table Display: Updates every 5 minutes or when overall action changes, showing per-timeframe analysis and the aggregated decision.
Ideal for swing traders, scalpers, and intraday momentum players who want high-confidence trade direction filtered through multiple technical layers.

SM Trap Detector – Liquidity Sweeps & Institutional ReversalsOverview:
This script is designed to help traders detect Smart Money traps, liquidity grabs, and false breakouts with high precision.
Inspired by institutional trading logic (SMC, ICT, Wyckoff), this tool combines:
🟦 Liquidity Zone Mapping – Detects stop hunt targets near highs/lows
🚨 Trap Candle Detection – Identifies fakeouts using wick + volume logic
✅ Reversal Confirmation – Entry signals based on real market structure
🧭 Dashboard Panel – Always see the last trap type, price, and confirmation
🔔 Real-Time Alerts – Stay notified of traps and entry points
🧠 Logic Breakdown:
Trap Candle = Large wick, small body, volume spike, and sweep of a liquidity zone
Confirmed Entry = Reversal price action following the trap (engulfing-style)
📈 Best Used On:
Markets: Crypto, Forex, Stocks
Timeframes: No limitation but works best on 1H, 4H, Daily
🛠 Suggested Use:
Trade only confirmed entries for best results
Place stops beyond wick highs/lows
Target previous structure or use RR-based exits
📊 Backtest Tip:
Use alerts + replay mode to manually validate past traps.
Note: Please backtest before using it for entry.


Liquidity Grab Entry Signals [Daily Enhanced]Liquidity Grab Entry Signals is a powerful tool designed to detect intraday reversal opportunities around daily high/low liquidity zones.
Core features: – Plots current daily high/low levels
– Identifies price interaction with these key zones
– Confirms rejection via strong engulfing candles
– Plots real-time long/short entry signals directly on chart
– Includes alerts for both long and short setups
This script is ideal for scalpers and intraday traders looking to exploit stop hunts, liquidity sweeps, and false breakouts.
Optimized for instruments like US30, NAS100, Gold, BTC and more.
Customize the sensitivity buffer to suit your asset and timeframe.
Use this in combination with VWAP, FVG or Smart Money concepts for enhanced confirmation.
---
Built for: 1s–15m charts
Includes: Alerts + Custom Settings
Type: Non-repainting
Trade with clarity around the most manipulated price levels of the day.

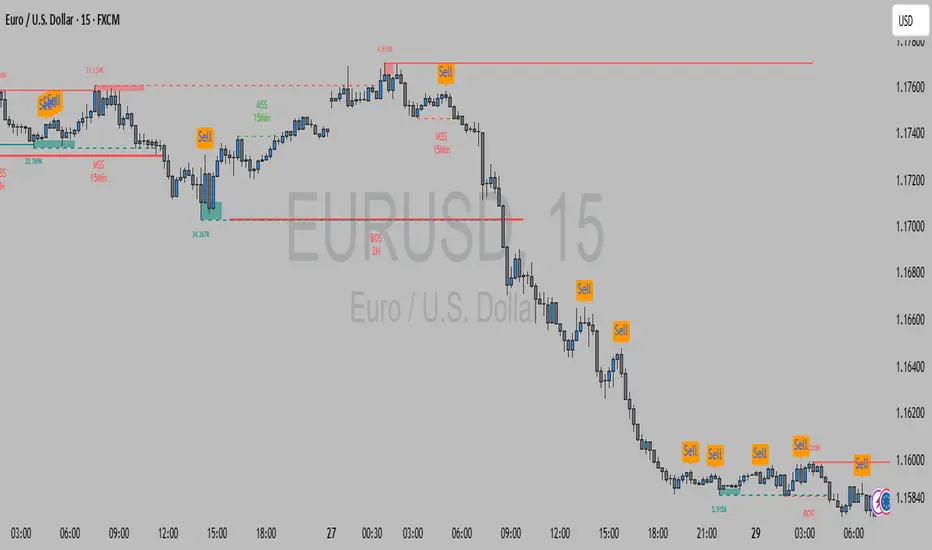
SMC Structure IndicatorTitle: SMC Structures Indicator
Description:
The SMC Structures indicator is a powerful tool designed to identify and visualize key structural elements in price action, based on the principles of Smart Money Concepts (SMC). This indicator helps traders identify potential areas of support, resistance, and price reversals by highlighting significant market structures.
Key Features:
Structure Identification: The indicator automatically detects and marks important high and low structures in the market.
Break of Structure (BOS) Detection: It identifies and labels instances where previous structures are broken, indicating potential trend changes or continuations.
Change of Character (CHoCH) Detection: The indicator recognizes and marks Changes of Character, which are significant shifts in market behavior.
Customizable Visuals: Users can personalize the appearance of BOS and CHoCH markings, including colors, line styles, and widths.
Current Structure Display: The indicator can optionally show the current active structure, helping traders understand the immediate market context.
Historical Structure Tracking: Users can specify the number of historical structure breaks to display, allowing for a cleaner chart while maintaining relevant information.
Flexible Break Confirmation: The indicator offers the option to confirm structure breaks using either the candle body or wick, accommodating different trading styles.
Technical Details:
The indicator uses advanced algorithms to identify significant price structures based on local highs and lows.
It employs a lookback period of 10 bars for structure detection, ensuring relevance to current market conditions.
The code includes safeguards to handle different market phases and avoid false signals during ranging periods.
Customization Options:
Colors for Bullish and Bearish BOS and CHoCH markings
Line styles and widths for all structure markings
Number of historical breaks to display
Option to show or hide the current active structure
Choice between candle body or wick for structure break confirmation
Use Cases:
Trend Analysis: Identify the start of new trends or potential trend reversals.
Support and Resistance: Pinpoint key levels where price may react.
Trade Entry and Exit: Use structure breaks as potential entry or exit signals.
Market Context: Understand the broader market structure to make informed trading decisions.

Mig Trade Model - Kill Zones
Key features:
Liquidity Hunt Detection: Spots aggressive moves that "hunt" stops beyond recent swing highs/lows.
Consolidation Filter: Requires 1-3 small-range candles after a hunt before confirming with a strong candle.
Bias Application: Uses daily open/close to auto-detect bias or allows manual override.
Kill Zone Restriction: Limits signals to London (default: 7-10 AM UTC) and NY (default: 12-3 PM UTC) sessions for better relevance in active markets.
This strategy is inspired by smart money concepts (SMC) and ICT (Inner Circle Trader) methodologies, aiming to capture venom-like "stings" in price action where liquidity is grabbed before reversals.
How It Works
ATR Calculation: Uses a user-defined ATR length (default: 14) to measure volatility, which scales candle body and range thresholds.
Bias Determination:
Auto: Compares daily close to open (bullish if close > open).
Manual: User selects "Bullish" or "Bearish."
Strong Candles:
Bullish: Green candle with body > 2x ATR (configurable).
Bearish: Red candle with body > 2x ATR.
Small Range Candles:
Candles where high-low < 0.5x ATR (configurable).
Liquidity Hunt:
Bullish Hunt: Strong bearish candle making a new low below the past swing low (default: 10 bars).
Bearish Hunt: Strong bullish candle making a new high above the past swing high.
Signal Generation:
After a hunt, counts 1-3 small-range candles.
Confirms with a strong candle in the opposite direction (e.g., strong bullish after bearish hunt).
Resets if >3 small candles or an opposing strong candle appears.
Kill Zone Filter:
Checks if the current bar's time (in UTC) falls within London or NY Kill Zones.
Only allows final "Buy" (bullish entry) or "Sell" (bearish entry) if bias matches and in Kill Zone.
Plots:
Yellow circle (below): Bullish liquidity hunt.
Orange circle (above): Bearish liquidity hunt.
Blue diamond (below): Raw bullish signal.
Purple diamond (above): Raw bearish signal.
Green triangle up ("Buy"): Filtered bullish entry.
Red triangle down ("Sell"): Filtered bearish entry.
Inputs
Bias: "Auto" (default), "Bullish", or "Bearish" – Controls signal direction based on daily trend.
ATR Length: 14 (default) – Period for ATR calculation.
Swing Length for Liquidity Hunt: 10 (default) – Bars to look back for swing highs/lows.
Strong Candle Body Multiplier (x ATR): 2.0 (default) – Threshold for strong candle bodies.
Small Range Multiplier (x ATR): 0.5 (default) – Threshold for small-range candles.
London Kill Zone Start/End Hour (UTC): 7/10 (default) – Customize London session hours.
NY Kill Zone Start/End Hour (UTC): 12/15 (default) – Customize New York session hours.
Usage Tips
Timeframe: Best on lower timeframes (e.g., 5-15 min) for intraday trading, especially forex pairs like EURUSD or GBPUSD.
Timezone Adjustment: Inputs are in UTC. If your chart is in a different timezone (e.g., EST = UTC-5), adjust hours accordingly (e.g., London: 2-5 AM EST → 7-10 UTC).
Risk Management: Use with stop-loss (e.g., beyond the hunt low/high) and take-profit based on ATR multiples. Not financial advice—backtest thoroughly.
Customization: Tweak multipliers for different assets; higher for volatile cryptos, lower for stocks.
Limitations: Relies on historical data; may generate false signals in ranging markets. Combine with other indicators like volume or support/resistance.
This indicator is for educational purposes. Always use discretion and proper risk management in live trading. If you find it useful, feel free to share feedback or suggestions!

Accumulation Phase DetectorClean Accumulation Phase Indicator — Description
This TradingView indicator visually identifies the Accumulation Phase in price action, based on the Wyckoff methodology and volume-price analysis. The Accumulation Phase is where insiders or "smart money" gradually build positions before a significant price breakout.
Key Features:
Range Detection: The indicator calculates a price range over a configurable period (Range Length). It marks this range on the chart with red horizontal lines representing support and resistance.
Volume Spike Identification: It detects unusually high volume relative to the average volume over the same period (Volume Spike Multiplier). These spikes highlight potential insider buying activity.
Accumulation Phase Highlighting: When price action remains within the detected range and volume spikes occur, the indicator considers the market to be in an accumulation phase. Volume bars during this phase are colored blue for easy visualization.
Campaign Start & End Labels: The indicator places a "Campaign starts" label at the beginning of the accumulation phase and a "Campaign ends - warehouse full" label when the accumulation ends. This mimics the idea that insiders fill their “warehouses” before a breakout.
Breakout Detection: Once accumulation ends, the indicator monitors for a price breakout above the resistance level and places a "Breakout" label at the breakout bar.
How to Use:
Adjust the Range Length and Volume Spike Multiplier inputs to suit the timeframe and instrument you’re analyzing.
Watch for the blue volume bars within the red range lines to identify the accumulation phase.
Use the campaign labels to identify when the phase starts and ends.
Watch for the breakout label as a potential entry signal.

SMC_CommonLibrary "SMC_Common"
Common types and utilities for Smart Money Concepts indicators
get_future_time(bars_ahead)
Parameters:
bars_ahead (int)
get_time_at_offset(offset)
Parameters:
offset (int)
get_mid_time(time1, time2)
Parameters:
time1 (int)
time2 (int)
timeframe_to_string(tf)
Parameters:
tf (string)
is_psychological_level(price)
Parameters:
price (float)
detect_swing_high(src_high, lookback)
Parameters:
src_high (float)
lookback (int)
detect_swing_low(src_low, lookback)
Parameters:
src_low (float)
lookback (int)
detect_fvg(h, l, min_size)
Parameters:
h (float)
l (float)
min_size (float)
analyze_volume(vol, volume_ma)
Parameters:
vol (float)
volume_ma (float)
create_label(x, y, label_text, bg_color, label_size, use_time)
Parameters:
x (int)
y (float)
label_text (string)
bg_color (color)
label_size (string)
use_time (bool)
SwingPoint
Fields:
price (series float)
bar_index (series int)
bar_time (series int)
swing_type (series string)
strength (series int)
is_major (series bool)
timeframe (series string)
LiquidityLevel
Fields:
price (series float)
bar_index (series int)
bar_time (series int)
liq_type (series string)
touch_count (series int)
is_swept (series bool)
quality_score (series float)
level_type (series string)
OrderBlock
Fields:
start_bar (series int)
end_bar (series int)
start_time (series int)
end_time (series int)
top (series float)
bottom (series float)
ob_type (series string)
has_liquidity_sweep (series bool)
has_fvg (series bool)
is_mitigated (series bool)
is_breaker (series bool)
timeframe (series string)
mitigation_level (series float)
StructureBreak
Fields:
level (series float)
break_bar (series int)
break_time (series int)
break_type (series string)
direction (series string)
is_confirmed (series bool)
source_swing_bar (series int)
source_time (series int)
SignalData
Fields:
signal_type (series string)
entry_price (series float)
stop_loss (series float)
take_profit (series float)
risk_reward_ratio (series float)
confluence_count (series int)
confidence_score (series float)
strength (series string)
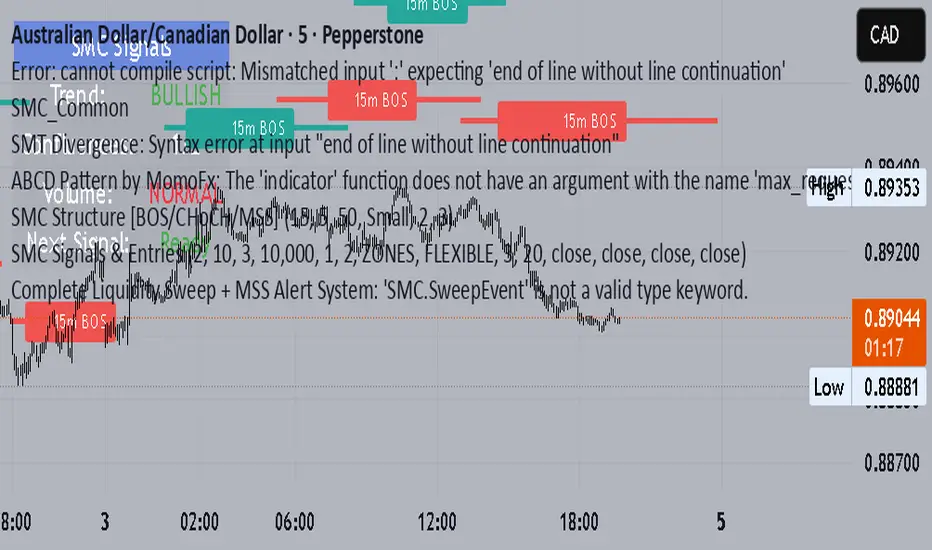
SMC TimingThis indicator (“SMC Timing”) visually marks the exact moments when the market typically experiences large liquidity injections—moments that often trigger strong directional moves. By plotting dashed vertical lines and labels at key session boundaries and news events (Frankfurt open, London open, EU mid-session pause, Pre-US, US open, 14:30 U.S. news releases, 15:00 breakout window, and the London close), it draws your attention to the times when stop-runs and institutional orders tend to pile into the market.
Traders can use these timing zones to:
Anticipate liquidity sweeps where smart-money often liquidates weak positions or hunts stops.
Plan higher-probability entries just before or directly after these injections, reducing slippage and improving execution.
Improve win-rate consistency by aligning your trades with the natural ebb and flow of institutional flow rather than fading it.
With customizable session toggles, a “today-only” filter, and a small vertical offset to keep markers clear of price bars, this tool seamlessly integrates into any chart. Positioning yourself around these highlighted times helps you capture the bulk of intraday moves and avoids getting caught in low-liquidity chop.
Mara JPY Strength (USDJPY+EURJPY+GBPJPY)/3 + DXYJPY, USDJPY, EURJPY, GBPJPY, smart money, bias, index, forex indicator, DXY, strength meter, professional, trading tool, price action

Mara JPY Bias ProMara JPY Bias Pro™ is a precision tool built for serious traders who focus on JPY and USD pairs.
This synthetic index combines USDJPY + EURJPY + GBPJPY, generating a smooth and dynamic representation of JPY strength or weakness. When the line turns green, JPY is weakening — time to look for LONG setups on XXX/JPY pairs. When red, JPY is strengthening — ideal moment for SHORT trades.
Built-in bias logic with adjustable MA-based trend detection or slope/momentum view lets you customize signals based on your strategy.
Plus, we’ve included a normalized DXY overlay, so you can track USD strength in parallel — perfect for traders working with EUR/USD, GBP/USD, USD/JPY and JPY crosses.
💡 Designed for day traders, scalpers, and smart money traders looking for clean confluence.
✅ Features:
Visual color-coded JPY bias (Green = Long / Red = Short)
Optional USD (DXY) strength overlay
Customizable MA length and bias logic
Built-in alerts for bias shifts & momentum flips
🔔 Alert-ready – never miss a reversal.
Trade smarter. Cut the noise. Stay on the right side of the move.

FMX Trend Confirmation - No Reversals🔍 FMX Continuation Signal – No Reversals
Powered by the FMX Model (Fundamentals Meet Execution)
This indicator is designed to capture high-probability continuation trades only, avoiding risky reversals. It confirms buy or sell signals based on:
✅ 15-Minute Structure Shift Confirmation
✅ Liquidity Sweeps (stop hunts beyond recent highs/lows)
✅ Trend Validation using HTF SMA (default: 15min)
✅ Second Candle Close inside the sweep range — FMX-grade precision
📈 Green “Buy” labels appear when:
Liquidity is swept below recent lows
Price closes back inside the range
The higher timeframe trend is bullish
📉 Orange “Sell” labels appear when:
Liquidity is swept above recent highs
Price closes back inside the range
The higher timeframe trend is bearish
🛡️ No reversal signals are plotted. This tool is meant for traders who follow the trend with smart money logic, inspired by FMX principles.
Hidden Liquidity Shift DetectorPurpose
The Hidden Liquidity Shift Detector identifies candles that indicate potential hidden accumulation or distribution activity based on volume and price action behavior. These setups often represent institutional absorption of liquidity ahead of larger moves.
How It Works
The script detects candles with the following characteristics:
Small real body relative to the total candle range
A strong wick (upper or lower) indicating rejection
Volume significantly higher than the recent average
It flags:
Hidden Selling (Distribution) when a bearish candle has a long upper wick and high volume
Hidden Buying (Accumulation) when a bullish candle has a long lower wick and high volume
These candles are often missed by traditional indicators but may precede significant reversals or breakouts.
Features
Automatic detection of absorption-style candles
Volume spike filtering based on configurable multiplier
Wick and body ratio thresholds to fine-tune signal quality
Non-intrusive signal markers (colored circles)
Real-time alerts for hidden buying/selling signals
Usage Tips
Use on 15m to 4H charts for intraday detection, or Daily for swing setups
Combine with support/resistance or volume profile zones for higher conviction
Clusters of signals in the same area increase reversal probability
Can be used alongside Wyckoff-style logic or smart money concepts

🧠 Rogue BTC Dominance + BTC Price MonitorLiquidity never lies.
When whales are done pumping, they exit before price tanks, often during sideways chop or fake strength.
So we build a tracker that detects:
Volume drop during uptrend (distribution phase)
Exchange inflows of coins
Rising USDT.D while price holds → stealth exit
Divergence between price & on-chain flows
👁️ Quick Use Case: BTC/USDT with USDT.D Overlay
If you see this pattern:
BTC sideways or slow uptrend
Volume declining
USDT.D rising
BTC.D holding flat
→ Liquidity Exit Detected.
Smart money is exiting quietly, waiting for retail to hold the bag.
cd_sweep&cisd_CxOverview:
When the price is at a significant zone/level on a higher time frame (HTF), and it sweeps (breaks through and then closes back below/above) the high or low of the previous HTF candle, it is common to look for a Change in State of Delivery (CISD) on a lower time frame (LTF) to enter a trade.
This model can be summarized as:
HTF Sweep → LTF CISD (Optional: SMT / Divergences)
________________________________________
Working Principle & Details:
1. The indicator monitors price action on the selected HTF and tracks any sweep (violation) of the previous HTF candle's high or low. Simultaneously, it identifies CISD levels on the LTF. If SMT is enabled, it will appear as a label on the chart.
When both HTF sweep and LTF CISD conditions are met, the indicator marks the chart at the open of the next candle and triggers an alert if set.
CISD levels are tracked and updated whenever a new HTF high/low is formed.
2. The indicator monitors the formation of entry models on up to six selected pairs, displaying results in two separate tables:
o HTF Sweep Query Table: Monitors live HTF candles and reports pairs that meet the sweep condition.
o CISD Table: Displays the pairs where a valid entry model has formed. A "🔥" symbol indicates the condition has occurred.
3. Bias Visualization:
Based on the selected HTF, a visual band is shown at the bottom of the chart using the chosen bullish/bearish colors.
Bias is determined by:
o Candle closing above/below the previous one suggesting continuation.
o A failed close after a sweep implying potential reversal.
4. HTF Candles:
Displays HTF candles based on the user-defined time frame.
5. Optional SMT (Smart Money Technique):
Must be enabled in the menu and requires the correlated pair to be entered correctly for accurate results.
Displayed only as a visual confirmation, not a requirement for model formation.
If the currently open symbol sweeps the previous candle while the correlated symbol does not (or vice versa), an "SMT" label appears on the chart.
6. Color & Table Positioning:
Controlled via the settings menu.
________________________________________
Warnings:
• The indicator only marks CISDs that form at HTF high/low zones.
• Entering every time the model forms does not guarantee profitability.
• Waiting for the model to appear at significant HTF levels/zones increases the likelihood of success.
• HTF and LTF selections should follow commonly accepted combinations or user-tested time frames.
• If you want to trigger alerts only for symbols entered in the indicator, ensure the "Use indicator alerts" option is enabled.
• To set alerts for the TradingView watchlist instead, disable the "Use indicator alerts" option.
________________________________________
Feel free to share your thoughts and suggestions.
Happy trading! 💫
